Data
Abercrombie & Fitch

American clothing retailer that defined 2000s mall fashion, and staged one of the decade’s most unlikely turnarounds.
8 figures on Abercrombie & Fitch, drawn from 3 Modern MBA case studies.
The figures
Percentages5
| | Against its own chart | |
|---|
| Cost of product as a share of revenue, 2022, against the gross margin it leaves behind · Gross margin | 57% | 3rd of 7 · top 76% | How a $1,000 jacket became a luxury brand |
|---|
| Selling, general and administrative costs as a share of revenue, 2022 | 47% | 4th of 8 · top 59% | How a $1,000 jacket became a luxury brand |
|---|
| Cost of product as a share of revenue, 2022, against the gross margin it leaves behind · Cost of product | 43% | 5th of 7 · top 66% | How a $1,000 jacket became a luxury brand |
|---|
| Canada Goose's wholesale operating margin — its least profitable channel — against the overall margins of the mass market | 16% | 2nd of 8 · top 32% | How a $1,000 jacket became a luxury brand |
|---|
| Overall operating margin, 2022 | 16% | 4th of 9 · top 41% | How a $1,000 jacket became a luxury brand |
|---|
Counts2
| | Against its own chart | |
|---|
| US store count in 2006 against the leading brick-and-mortar brands of the period | 930 | 3rd of 5 · top 7,102 | Why GameStop failed |
|---|
| Annual inventory turnover by brand, 2023 | 3.1 | 4th of 9 · top 5.1 | Why UNIQLO makes more money than Gucci |
|---|
Case studies covering Abercrombie & Fitch

 Case study — Retail & brandsWhy UNIQLO makes more money than GucciSame playbook, three outcomes. The only variable was whether the boss knew what stage he was in.16 min read
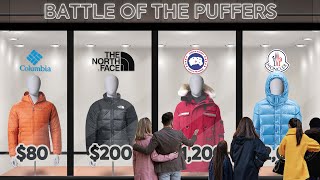 Case study — Retail & brandsHow a $1,000 jacket became a luxury brandCanada Goose built a real luxury brand in ten years. The margins prove it. The share price says it may not matter.14 min read
 Case study — Retail & brandsWhy GameStop failedThe pre-owned disc was a perpetuity at 47% margins. Then the publishers worked out how to make it non-transferable.14 min read