Data
Nike

The largest sportswear company in the world, an American brand with nearly twice the revenue of its closest rival, Adidas.
28 figures on Nike, drawn from 5 Modern MBA case studies.
The figures
US dollars12
| | Against its own chart | |
|---|
| Annual footwear sales in millions of dollars · 2019 | $24,222M | 1st of 10 · top $24,222M | Why the sneaker market collapsed |
|---|
| Annual footwear sales in millions of dollars · 2018 | $22,268M | 2nd of 10 · top $24,222M | Why the sneaker market collapsed |
|---|
| Annual footwear sales in millions of dollars · 2017 | $21,081M | 3rd of 10 · top $24,222M | Why the sneaker market collapsed |
|---|
| Annual footwear sales in millions of dollars · 2016 | $19,871M | 4th of 10 · top $24,222M | Why the sneaker market collapsed |
|---|
| Annual footwear sales in millions of dollars · 2015 | $18,318M | 5th of 10 · top $24,222M | Why the sneaker market collapsed |
|---|
| Annual footwear sales in millions of dollars · 2014 | $16,208M | 6th of 10 · top $24,222M | Why the sneaker market collapsed |
|---|
| Annual footwear sales in millions of dollars · 2013 | $14,539M | 7th of 10 · top $24,222M | Why the sneaker market collapsed |
|---|
| Annual footwear sales in millions of dollars · 2012 | $13,426M | 8th of 10 · top $24,222M | Why the sneaker market collapsed |
|---|
| Annual footwear sales in millions of dollars · 2011 | $11,519M | 9th of 10 · top $24,222M | Why the sneaker market collapsed |
|---|
| Annual footwear sales in millions of dollars · 2010 | $10,301M | 10th of 10 · top $24,222M | Why the sneaker market collapsed |
|---|
| University endowments against the cash reserves of leading corporations, in billions of dollars | $9.2B | 8th of 10 · top $56.9B | Why college is so expensive in America |
|---|
| Average order value in 2023 | $88 | 6th of 7 · top $286 | Why the sneaker market collapsed |
|---|
Percentages14
| | Against its own chart | |
|---|
| Cost of product as a share of revenue, 2022, against the gross margin it leaves behind · Cost of product | 55% | 2nd of 7 · top 66% | How a $1,000 jacket became a luxury brand |
|---|
| Cost of product as a share of revenue, 2022, against the gross margin it leaves behind · Gross margin | 46% | 6th of 7 · top 76% | How a $1,000 jacket became a luxury brand |
|---|
| Gross margins of platforms against brands and manufacturers | 46% | 6th of 8 · top 82% | Why Temu and Wish can't make money |
|---|
| North America as a share of total revenue · 2012 | 42% | 2nd of 3 · top 94% | Why Under Armour failed |
|---|
| North America as a share of total revenue · 2009 | 41% | 2nd of 3 · top 94% | Why Under Armour failed |
|---|
| Selling, general and administrative costs as a share of revenue, 2022 | 32% | 8th of 8 · top 59% | How a $1,000 jacket became a luxury brand |
|---|
| North American revenue growth · 2013 | 18% | 1st of 6 · top 18% | Why Under Armour failed |
|---|
| North American revenue growth · 2012 | 17% | 2nd of 6 · top 18% | Why Under Armour failed |
|---|
| Canada Goose's wholesale operating margin — its least profitable channel — against the overall margins of the mass market | 15% | 3rd of 8 · top 32% | How a $1,000 jacket became a luxury brand |
|---|
| Overall operating margin, 2022 | 15% | 5th of 9 · top 41% | How a $1,000 jacket became a luxury brand |
|---|
| North American revenue growth · 2011 | 13% | 3rd of 6 · top 18% | Why Under Armour failed |
|---|
| North American revenue growth · 2015 | 12% | 4th of 6 · top 18% | Why Under Armour failed |
|---|
| North American revenue growth · 2014 | 10% | 5th of 6 · top 18% | Why Under Armour failed |
|---|
| North American revenue growth · 2016 | 7% | 6th of 6 · top 18% | Why Under Armour failed |
|---|
Counts2
| | Against its own chart | |
|---|
| Retail stores worldwide, 2009 and 2012 · 2012 | 826 | 2nd of 3 · top 2,446 | Why Under Armour failed |
|---|
| Retail stores worldwide, 2009 and 2012 · 2009 | 674 | 2nd of 3 · top 2,200 | Why Under Armour failed |
|---|
Case studies covering Nike

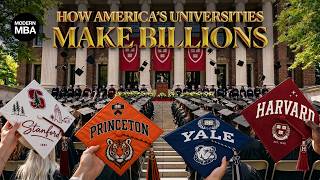 Case study — ServicesWhy college is so expensive in AmericaHarvard holds $57B and charges $82,866 a year. Tuition isn't the business — the undergraduate is the seed, not the customer.16 min read
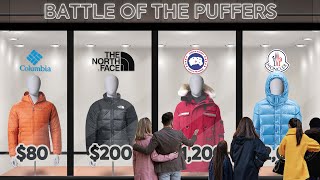 Case study — Retail & brandsHow a $1,000 jacket became a luxury brandCanada Goose built a real luxury brand in ten years. The margins prove it. The share price says it may not matter.14 min read
 Case study — TechnologyWhy Temu and Wish can't make moneyWish spent 90 cents of every revenue dollar on ads to buy customers worth $10. AliExpress never profited either. Temu is next.15 min read
 Case study — Retail & brandsWhy the sneaker market collapsedStimulus money made everyone a reseller. What survived is the people who can price a used shoe from memory.11 min read
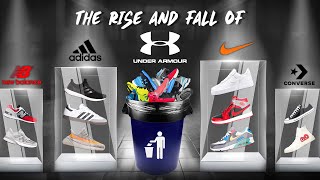 Case study — Retail & brandsWhy Under Armour failedIts products were ugly. Rather than fix that, Kevin Plank spent $700M on fitness apps and called Under Armour a tech company.14 min read